
Sign in

2020 DE Health
The AI Causal Graph delineates the true determinants of financial strength. At the top of the graph, data from public annual reports is inputted. These variables are synthesized to ultimately produce the Economic Capital Ratio. Green nodes signify the company's strengths relative to the market average, enhancing financial robustness, whereas red nodes indicate weaknesses.
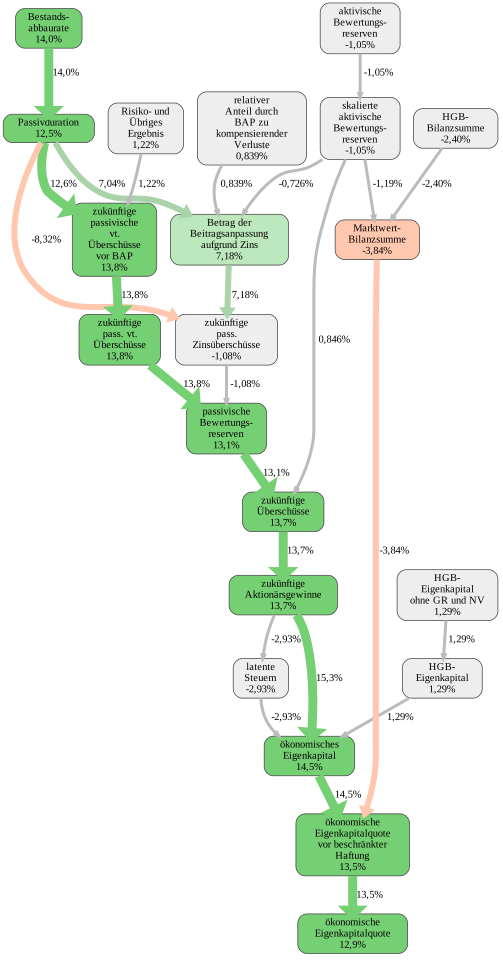
The Causal Effects in each node indicate the individual impact of that variable on the final node, the Economic Capital Ratio. They reveal the extent to which the Economic Capital Ratio increases or decreases relative to the industry average. Cumulatively, these effects contribute to the overall Economic Capital Ratio.
| Causal Effects | EFFECT IN % POINTS |
|---|---|
| HGB-Eigenkapital | 1,29 |
| ökonomisches Eigenkapital | 14,5 |
| HGB-Eigenkapital ohne GR und NV | 1,29 |
| Bestands|abbau|rate | 14,0 |
| Passivduration | 12,5 |
| zukünftige passivische vt. Überschüsse vor BAP | 13,8 |
| Betrag der Beitragsanpassung aufgrund Zins | 7,18 |
| zukünftige pass. Zinsüberschüsse | -1,08 |
The Input Variables consist of the absolute values from the public annual report data entered into the valuation model.
| Input Variables | IN 1000 EUR |
|---|---|
| Aufwendungen für Betrieb | 6.820 |
| Aufwendungen für Versicherungsfälle | 37.263 |
| Bestandsabbaurate | 2,0% |
| Buchwert Kapitalanlagen | 509.862 |
| Genussrechte | 0 |
| HGB- Alterungsrückstellung netto | 451.489 |
| HGB-Beitragsüberträge | 1.985 |
| HGB-Bilanzsumme | 533.640 |
| HGB-Eigenkapital ohne GR und NV | 28.200 |
The output variables are the absolute values as calculated by the valuation model.
| Output Variables | IN 1000 EUR |
|---|---|
| HGB-Eigenkapital | 28.200 |
| Kapitalergebnis | 11.683 |
| für Überschussbet. anrechenbarer Anteil der Kapitalanlagen | 89% |
| Zinsaufwand | 10.190 |
| mittlerer Tarifrechnungszins | 2,3% |
| Passivduration | 58 |
| Schadenquote | 44% |
| Kostenquote | 8,1% |
| Combined Ratio | 53% |
| relativer Anteil durch BAP zu kompensierender Verluste |
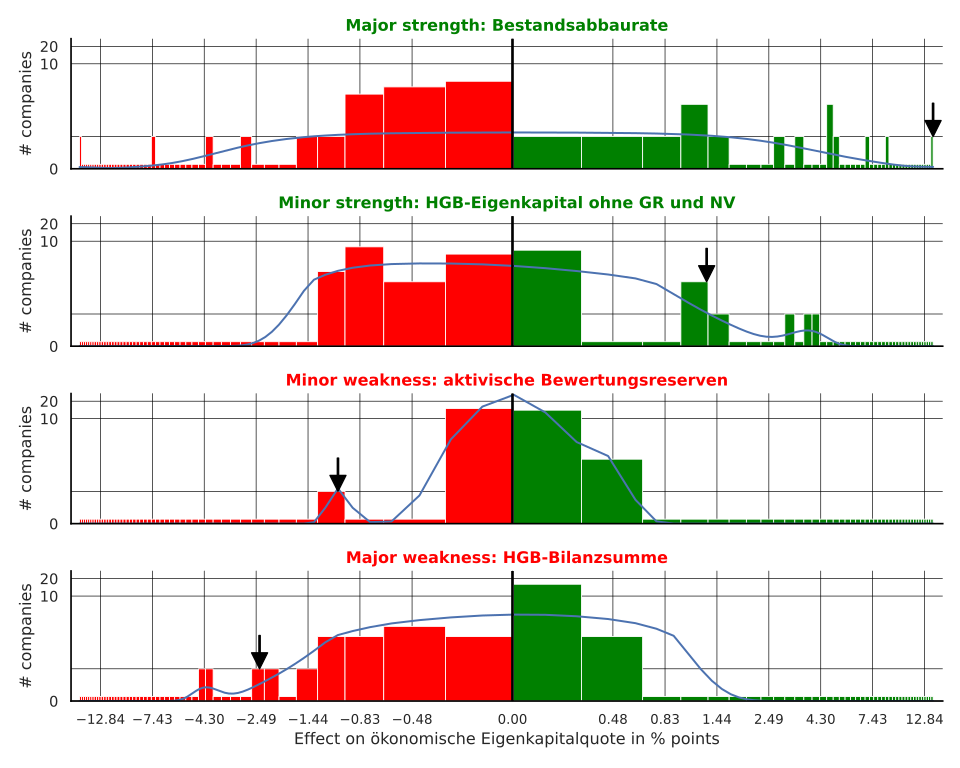
The Feature Distribution illustrates the distribution of the model variables' effect values across the industry. The specific effect of the company in question within this distribution is indicated by a black arrow. The top two charts highlight the company's greatest strengths, whereas the bottom two charts reveal its most significant weaknesses.
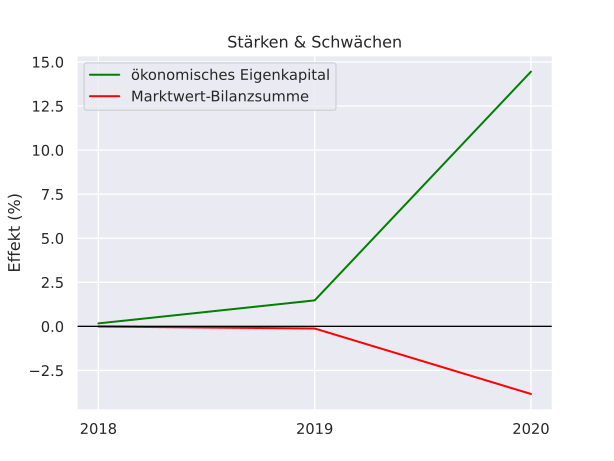
The strengths and weaknesses plot shows how the company's greatest strengths and weaknesses develop over time. The corresponding impact measures the percentage point increase or decrease in the Economic Capital Ratio.
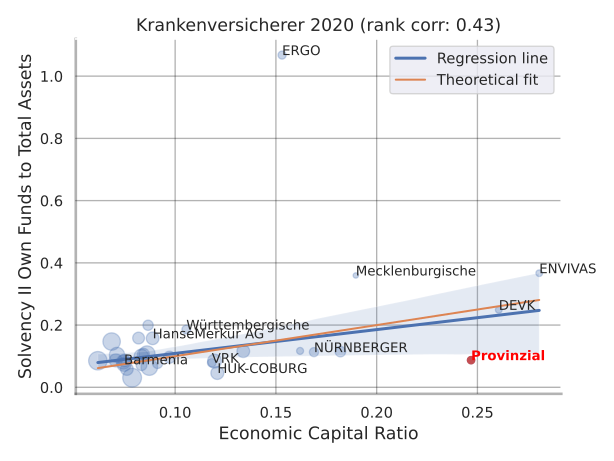
The Regression compares the forecasted company valuation with the observed stock market values. A positive correlation suggests that the model effectively explains market prices. A company's valuation above the regression line indicates that the company is overvalued, otherwise it is undervalued.
| relativer Anteil durch BAP zu kompensierender Verluste |
| 0,839 |
| zukünftige pass. vt. Überschüsse | 13,8 |
| Risiko- und Übriges Ergebnis | 1,22 |
| aktivische Bewertungs|reserven | -1,05 |
| skalierte aktivische Bewertungs|reserven | -1,05 |
| zukünftige Überschüsse | 13,7 |
| Marktwert-Bilanzsumme | -3,84 |
| passivische Bewertungs|reserven | 13,1 |
| zukünftige Aktionärsgewinne | 13,7 |
| latente Steuern | -2,93 |
| ökonomische Eigenkapitalquote vor beschränkter Haftung | 13,5 |
| HGB-Bilanzsumme | -2,40 |
| ökonomische Eigenkapitalquote | 12,9 |
| HGB-Schadenrückstellung |
| 8.710 |
| Kapitalanlage-Aufwendungen | 184 |
| Kapitalanlage-Erträge | 11.867 |
| Risiko- und Übriges Ergebnis | 12.903 |
| Zinsüberschussbeteiligung gem. §150 VAG | 140 |
| aktivische Bewertungsreserven | 103.290 |
| nachrangige Verbindlichkeiten | 0 |
| verdiente Beiträge feR | 83.780 |
| 96% |
| zukünftige passivische Zinsüberschüsse vor BAP | -400.291 |
| zukünftige passivische vt. Überschüsse vor BAP | 749.402 |
| skalierte aktivische Bewertungsreserven | 103.290 |
| Betrag der Beitragsanpassung aufgrund Zins | 295.500 |
| Betrag der Beitragsanpassung aufgrund Risiko | 0 |
| zukünftige pass. Zinsüberschüsse | -104.791 |
| zukünftige pass. vt. Überschüsse | 749.402 |
| passivische Bewertungsreserven | 644.612 |
| zukünftige Überschüsse | 747.902 |
| zukünftige Aktionärsgewinne | 149.580 |
| latente Steuern | 37.395 |
| ökonomisches Eigenkapital | 240.604 |
| Marktwert-Bilanzsumme | 636.930 |
| ökonomische Eigenkapitalquote vor beschränkter Haftung | 25% |
| ökonomische Eigenkapitalquote | 25% |